Ideal combination of
production and persistence.
Ideal combination of
production and persistence.
Relish Performance Review
IMPROVING RED CLOVER PERSISTENCE UNDER GRAZING
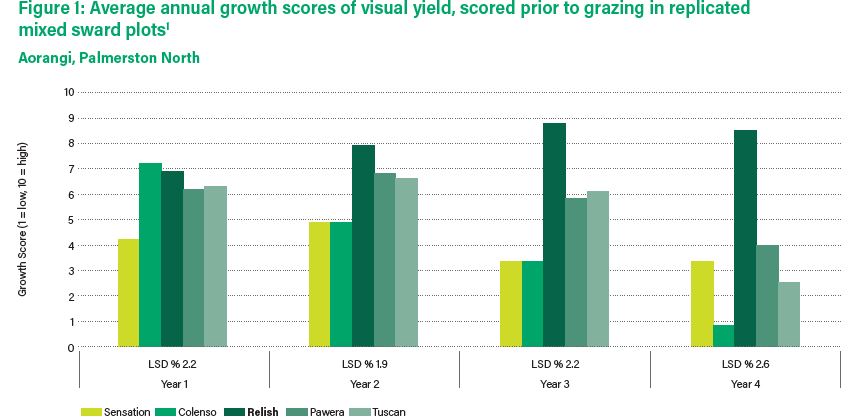
The 2011 New Zealand Grassland Association paper titled “Improving red clover persistence under grazing”, highlights the strengths of Relish red clover. This work by Ford and Barrett, assessed 142 red clover accessions replicated in mixed swards under cattle grazing. These included a collection of 99 experimental populations and cultivars brought into New Zealand in 2006, and 35 New Zealand derived breeding lines, including 16 F1 progeny lines developed by crossing ecotypes from countries including Portugal, Georgia, Yugoslavia and Turkey with elite New Zealand cultivars, and 19 synthetics including Grasslands Relish. Eight commercial red clover cultivars were included as controls.
 higher growth (Figure 1) and persistence (Figure 2) than all other entries over the three and a half years of the trial. Figure 1, 2 and Table 1 present the relevant commercial lines from this work. After three and a half years under grazing, 60% of the Relish plants were alive (Figure 2). This was more than any other entry, and significantly (P<0.05) more than any commercial cultivars in the trial. 1 Adapted from improving red clover persistence under grazing. Ford, et, al. (2011) Grasslands - Gisborne.")
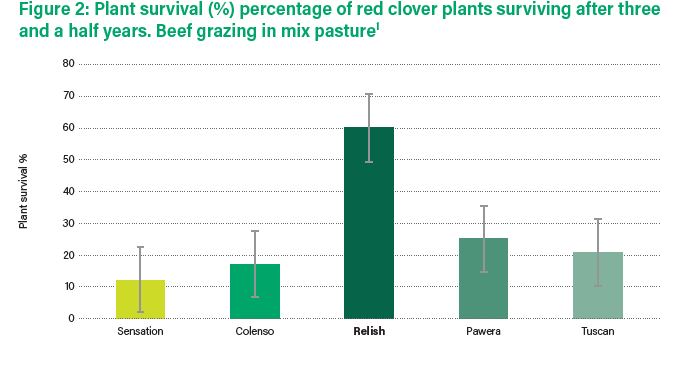
In this work Relish showed significantly (P<0.05) higher growth (Figure 1) and persistence (Figure 2) than all other entries over the three and a half years of the trial. Figure 1, 2 and Table 1 present the relevant commercial lines from this work. After three and a half years under grazing, 60% of the Relish plants were alive (Figure 2). This was more than any other entry, and significantly (P<0.05) more than any commercial cultivars in the trial. 1 Adapted from improving red clover persistence under grazing. Ford, et, al. (2011) Grasslands - Gisborne.
RED CLOVER GROWTH CHARACTERISTICS
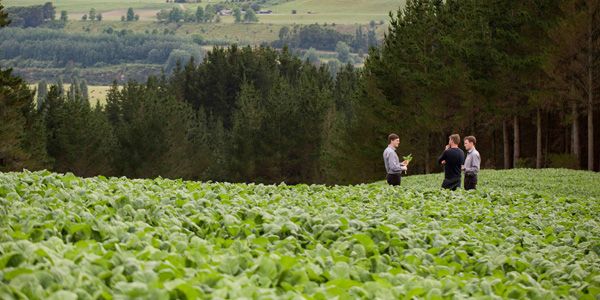
Relish red clover has been extremely successful on farm across New Zealand. Relish was awarded the AgResearch Impact Prize in 2018. Relish is highly productive in the spring, and its semi-erect growth habit makes it suitable for set stocked lambing (as early as September).
 higher growth (Figure 1) and persistence (Figure 2) than all other entries over the three and a half years of the trial. Figure 1, 2 and Table 1 present the relevant commercial lines from this work. After three and a half years under grazing, 60% of the Relish plants were alive (Figure 2). This was more than any other entry, and significantly (P<0.05) more than any commercial cultivars in the trial. 1 Adapted from improving red clover persistence under grazing. Ford, et, al. (2011) Grasslands - Gisborne.")
In this work Relish showed significantly (P<0.05) higher growth (Figure 1) and persistence (Figure 2) than all other entries over the three and a half years of the trial. Figure 1, 2 and Table 1 present the relevant commercial lines from this work. After three and a half years under grazing, 60% of the Relish plants were alive (Figure 2). This was more than any other entry, and significantly (P<0.05) more than any commercial cultivars in the trial. 1 Adapted from improving red clover persistence under grazing. Ford, et, al. (2011) Grasslands - Gisborne.
 shows similar results to that of Ford and Barrett (2011), with the benefits of Relish starting to separate from other genetics after year 1 (Figure 1).")
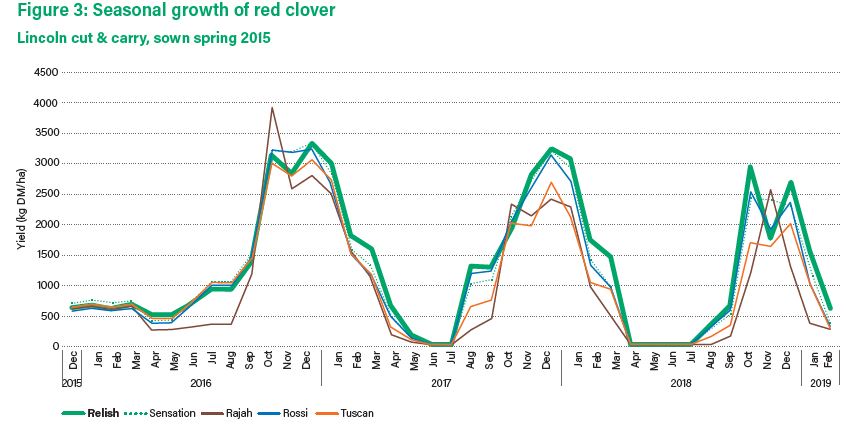
Figures 4 and 5 show the accumulated yield of different cultivars of pure stand red clover for 3.5 years. These were two separate replicated trials, but under different management. One trial was measured under a cut and carry system, and the other a rotational sheep grazed system, with the yield measurements taken prior to grazing. Under both managements, the first year total yield was very similar between all varieties, and it is not until the second year of growth where the differences in yield start to occur. This work (Figures 4 and 5) shows similar results to that of Ford and Barrett (2011), with the benefits of Relish starting to separate from other genetics after year 1 (Figure 1).
ACCELERATED AGING RED CLOVER RELISH & SENSATION
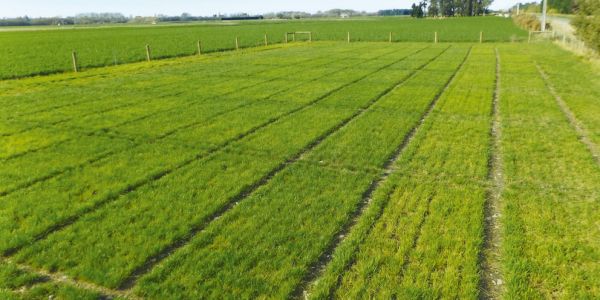
A red clover and lucerne trial was drilled in spring 2015. For year one, this had a standard management and was rotationally grazed. To demonstrate accelerated aging of these plots and put the cultivars under intense pressure, sheep were set stocked on the red clover and lucerne trial from the 27th January 2017 – 5th May 2017, for a total of 98 days.
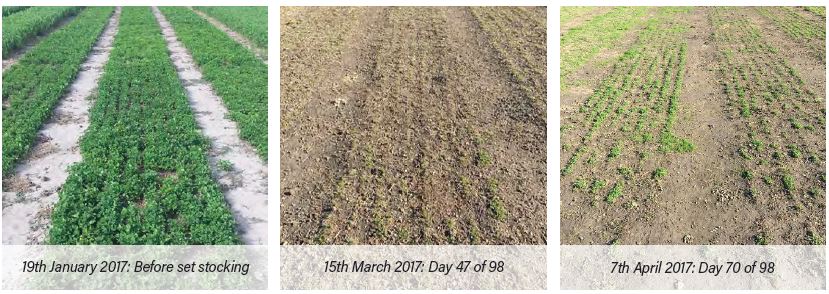

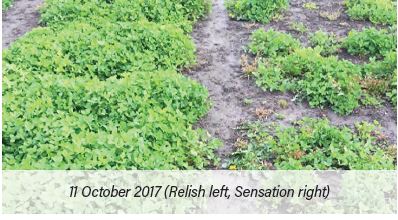
Figure 6 represents the ability of different red clover cultivars to survive under set stocking with sheep. This persistence also results in associated yield and production differences. The photo to the right shows the difference between some of these plots in spring 2017. There is a significant yield advantage in favour of Relish red clover. On the 16th October 2017 a one off yield measurement was taken, resulting in Relish having grown 1,753 kg DM/ha. The next closest cultivar grew 682 kg DM/ha less than Relish and the lowest yielding cultivar grew 1,285 kg DM/ha less than Relish.
ASSET & RELISH MIX TRIAL SOWN: 22ND MARCH 2017

Figure 7 shows a difference in yield of 15,206 kg DM/ha over a two year timeframe for the same amount of inputs, this highlights the potential of Relish’s nitrogen fixation ability and how significant it can be in low N environments.
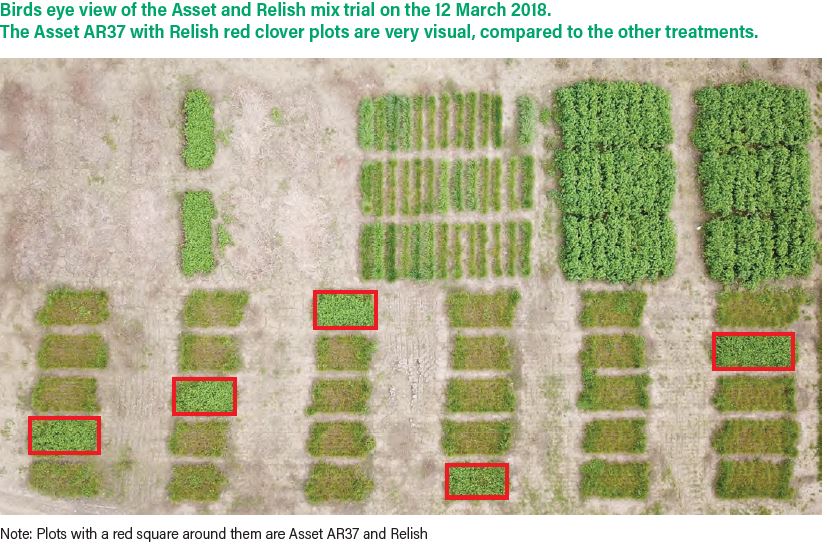

Figure 8 shows the monthly yields of different treatments. Each arrow represents a harvest date and therefore a treatment application. e.g. Asset AR37 with 100 kg urea/ha received seven applications of urea at 100 kg/ha. *Asset AR37 + Relish received no fertiliser, as well as two straight Asset AR37 plots.

Figure 9 shows the total yield achieved over seven harvests. After each harvest each plot received the above treatment. e.g. Asset + 100 kg urea/ha, received a total of 700 kg urea/ha for the period of the trial.
Back to About Agricom
About Agricom